- Circumstantiality
- Get Down (and Distance)
- Assume the Position
- Putting it together: building a model of the context
- A Matter of Time
- CHAPTER SUMMARY
Circumstantiality
So we’ve spent a lot of time so far talking about “the typical run.” We started off introducing the concept of the league-average run distribution, spent some time working with run distributions for particular players, and then talked about the importance of sample size in our chapter on resampling and simulation. But all of that was only done after glossing over the very first thing we ever said about the run game:
When a coach calls a running play in the NFL, what do they expect to see? What does a “typical” run look like? A good coach would probably say, “it depends.” Every call is intended to exploit the anticipated defense (or to set up a future attack on a particular defense) in a particular way in a particular circumstance. Designing runs is hard, calling the right play at the right time is hard, and executing a solid run is hard.
What you expect from a run differs depending on the defense, the field position, the down and distance, the game flow, the score, the previous plays, the quarter and time left in the half, maybe even shit like where you’re playing or the weather. Every run is called in order to try to exploit the particular circumstances of the game.
It’s about time we dove into those particulars.
Get Down (and Distance)
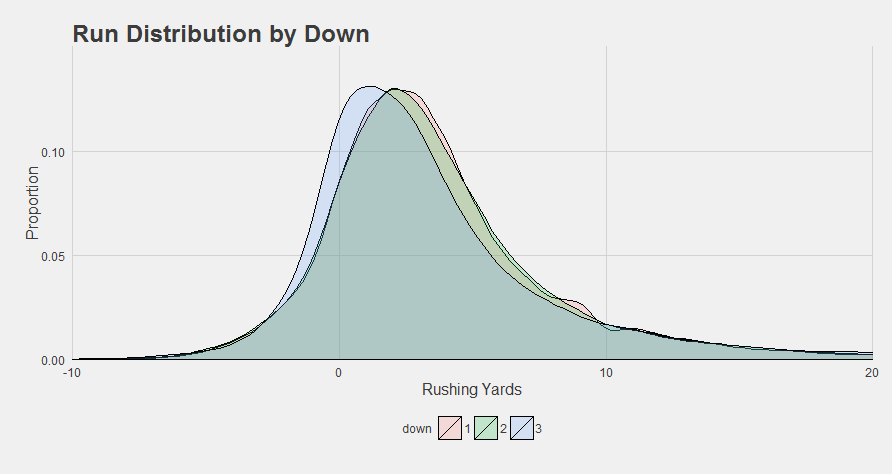
The story here is pretty straightforward: runs tend to go further on the “running downs”. Running on 3rd down is tough, but there isn’t much of a difference between 1st and 2nd down.
 “Except for the 10-yard divot on 1st down runs, of course.”
You can’t see it in the graphs, but 1st and 2nd downs are where the majority of these runs occurred to begin with.
“Oh, I happen to have the numbers for this, for 2010-2015.”
| Down | Proportion of Rushing Attempts |
|---|---|
| 1st | 56.5% |
| 2nd | 34.5% |
| 3rd | 8.2% |
| 4th | 0.8% |
“And like we discussed in chapter 4, we have more uncertainty when we have to work with smaller samples. So we’re not all that sure what a ‘typical’ 4th down run looks like, but we have a pretty good idea what the average YPC of a 1st down run should be.”
| Down | 95% confidence intervals for mean yards per carry |
|---|---|
| 1st | 4.18 - 4.31 |
| 2nd | 4.10 - 4.24 |
| 3rd | 3.68 - 3.99 |
| 4th | 2.57 - 3.72 |
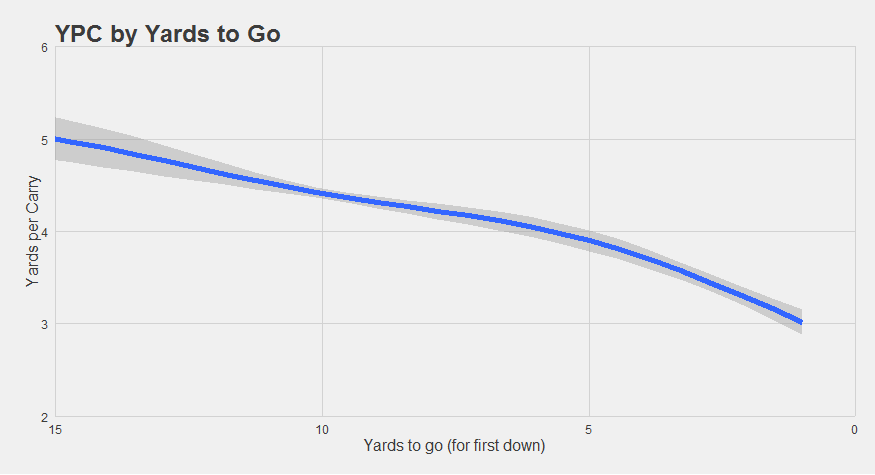
It’s worth considering why this is. It’s certainly possible that RBs or blockers are more winded on the later downs or something. But the majority of this decrease is probably due to the nature of when teams decide to call for a run, along with the types of runs that are called in different circumstances. Teams usually don’t run on a 3rd (or 4th) down without a good reason. When it’s 3rd down, you might run if you’re close to the line of gain, and you might run if you need to salt away the game. But both of these are pretty obvious to defenses. When they know the run is coming, they’re better at stopping it. It’s a balance: teams run when it’s advantageous for them to (e.g. to gain a first down on short yardage). But when a running play is more likely, defenses key on it, reducing its efficiency.
“This is borne out by the data. Take a look at the median distance from the yard to gain for runs on different downs.”
| Down | Median distance from yard to gain |
|---|---|
| 1st | 10 yards to go |
| 2nd | 7 yards to go |
| 3rd | 2 yards to go |
| 4th | 1 yards to go |
“More than half of all 3rd down runs by a running back take place within 2 yards of the first down, and more than half of 4th down attempts take place within 1 yard.”
This makes sense. Your chances of continuing a drive are better if you pass from a 3rd and 15 than if you run. The calculus changes when you’re closer to the line of gain, though. The risk of a run that’s too short is less than the risk of an incompletion.
“Though it’s good to stay unpredictable with your playcalls. Since 2010, teams have handed the ball to a running back on 4th down with 5 or more yards to go a total of 38 times, despite the fact that in a vacuum, a pass is more likely than a run to gain 5 yards.”
And does that work?
“Sometimes. For example, Jacquizz Rodgers took a carry once on a 4th and 8 (a long way to go on a run!), during the early third quarter of a reasonably close game against the Bucs in 2013. They lined up in punt formation on their own 44, but then sent a direct snap to Rodgers. He took it 14 yards for the first down.”
But more often than not, the running back fails to make the long gain in these situations, right? And the ball is turned over on downs?
“Well, yes, but that doesn't mean running in casese where the value of running is relatively low isn't important for other reasons. If you proove to the league that you are willing to run in such circumstances, it can help defenses respect your offensive balance more. Because if they fail to anticipate a play, it can make that play more effective. This is what happened in the Rodgers run.”
It’s certainly the case, for example, that the further away you start from the line of gain, the further you’re likely to go. This is consistent with the idea the defenses assume that teams will try to gain big yardages through the air instead of the ground, making running far from the line to gain relatively more effective.
It’s helpful to think about this from the defense’s perspective. When an extra yard is least useful to an offense (e.g. on a 3rd and long), the defense can most afford to yield it in order to have a better chance at preventing a more valuable play (e.g. a mid/long pass). They’d rather cover the bigger plays that would actually pose a risk of gaining a 1st down. Conversely, when the ground game is the most valuable to an offense (e.g. on a 3rd and short), the defense can least afford to play a soft front. The defense is always incentivized to take away the thing that the offense most wants to do.
Assume the Position
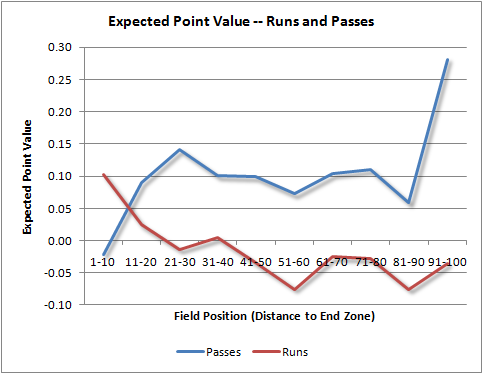
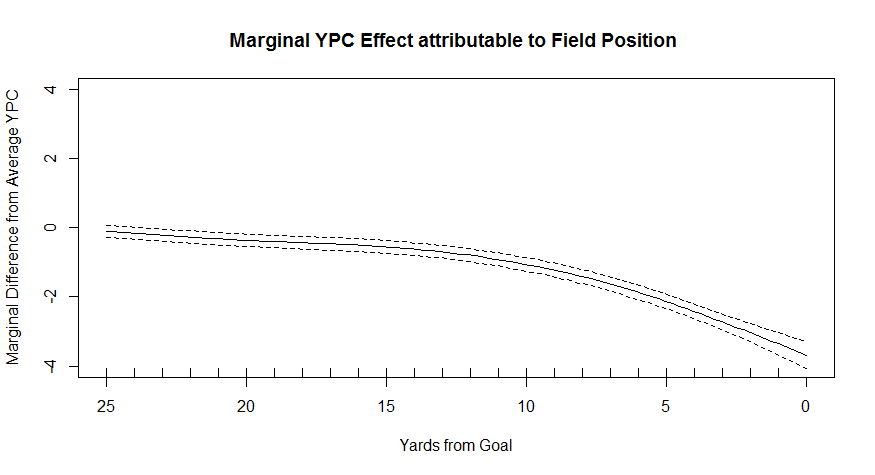
There are a number of other instances where the defense might want to protect more against the run. For example, field position can change the calculus on a play call (or play execution) quite a lot.
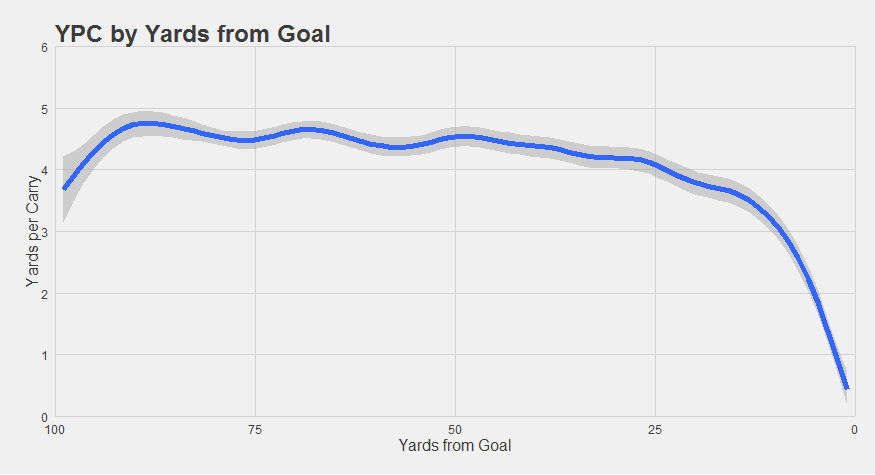
“Within the 25, running the ball starts to become increasingly less efficient. There’s also another decrease further back, near the OPP 30-45 range. Over this 15-yard span of the field, expected yardage gained on a run decreases by nearly half a yard. We speculate that running might be slightly more valuable as the offense approaches field goal range, just as running is more valuable as the offense approaches the goal line. Defenses could be trying to make a small stand near that landmark. It could be noise, but it’s plausible that entering field goal range is another instance (alongside gaining first downs in short-yardage situations and approaching the goal line) where the ground game is particularly valuable, and thus something that defenses try to take away.”
That half-yardage of change may look pretty small compared to the goal-line effect, but the goal-line effect is a little deceptive here. Remember, yardage becomes meaningless once you cross the plane of the goal line and score. The furthest you can possibly go from OPP 2 is two yards. Average yards per carry is thus going to be below two yards, even before you factor in any influence of the defense. You could be running by yourself in a completely empty field, and if you’re starting from the goal line, your “average yards per carry” is going to look trivially small.
“Lucky for you, this is something I can fix. Let’s say we take 10,000 random rushing attempts from the past six years from all over the field, and put an invisible marker at two yards. Any runs further than that, we convert to a two-yard run. This simulates the effect of the cutoff from running from the 2, but because these runs actually occurred from the middle of the field, they aren’t facing a goal-line defense. They’re just a typical run. In other words, this simulation accounts for the goal-line cutoff effect, but not the goal-line defense effect. Now, we take 10,000 new random runs and do the same for three yards, and then four, and five, and six etc. all the way up to 20 yards. At the end of it, we’ve simulated the effect of cutting runs short at the goal line from everywhere within the red zone. Any decrease in run efficiency above and beyond this goal-line cutoff effect is then attributable to goal-line defenses and play call effects etc. Let’s take a look.”
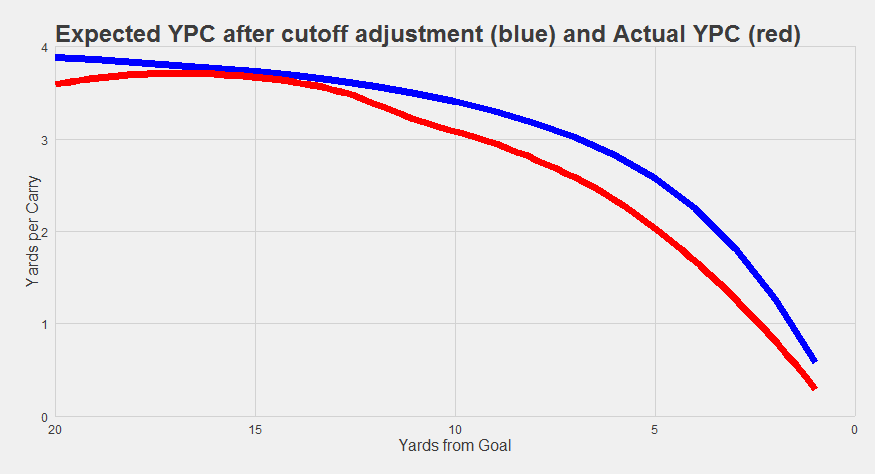
The blue line here is our cutoff simulation. It’s the yards per carry that we would expect to see if the goal-line cutoff was the only thing going on. The red line is the actual yards per carry we observe in the NFL. The difference between the lines - about half a yard for most runs within the 10 – is the effect of the situation (probably goal-line defenses). The field gets compressed, the offense has less room to impose “levels” passing concepts, safeties start closer to the box, and fronts tend to be heavier by nature of the defensive play calls. It makes a difference.
So why run the ball inside the 10 if the odds are stacked so much against you? Well, because it’s more likely to result in a touchdown anyways. Brian Burke’s old website “Advanced Football Analytics” did a post on this once. The key chart is here, showing how running the ball gets increasingly valuable inside the 20, while passing the ball starts decreasing in value over the same turf.
“Part of this could be do to the lower turnover rate in the run game than the passing game. Typical fumble rates for a run by a running back are about 0.5-1.5% (source here), while typical receptions by a WR, TE, or RB have about a 1-2% of being fumbled in addition to the interception rate on all passes of about 3%. You can't turn the ball over on the goal line if you want to win games, and running the ball helps you protect your possession.”
Putting it together: building a model of the context
It’s clear that down, distance, and field position all influence what we expect from a run. Running is measurably harder on the 3rd and 4th downs, on short-yardage attempts, or when the field position is nearing a critical threshold (first field goal range, then the end zone). But these things can interact in non-obvious ways.
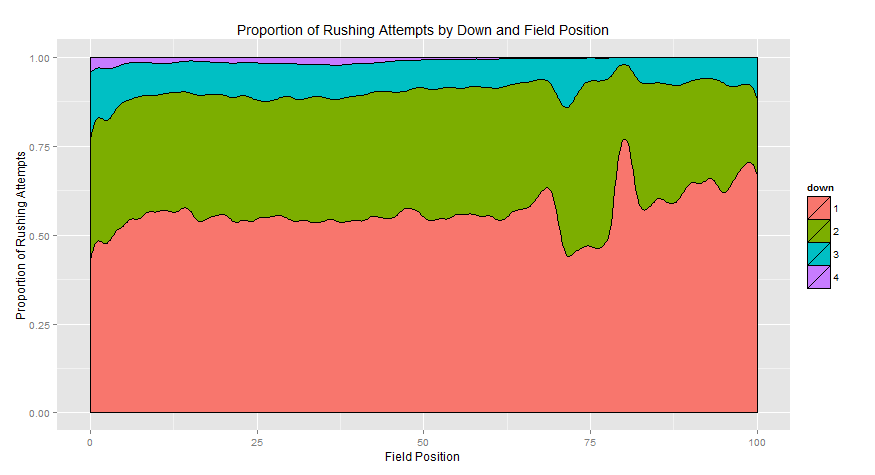
For instance, 3rd and 4th down runs are more likely to happen within 10 yards of goal than nearly anywhere else on the field (save for a bump of third-and-shorts following a touchback).
We know that expected yards per carry is lower within the 10 even after adjusting for the cutoff effect. But how much of the decrease is attributable to greater proportion of 3rd and 4th down runs (which are harder), and how much is attributable to the field position?
“We could answer this question by looking at just 1st down runs within the 10 or something to see if the field position still mattered when we held the down constant. But we can do one better than that. What we need is a model of these situational factors.”
A “model” in this case is just a mathematical description of how our “predictors” – down, distance, and field position – all work together to influence our “outcome”, or expected yardage on a rushing attempt. It is designed to capture the systematic relationships. Some types of models emphasize flexibility and prediction accuracy in a format that computers (but not people) are good at extracting meaning from, while other types of models emphasize interpretability, limiting themselves only to the types of relationships that are relatively intuitive. We’re going to try to strike a middle ground here. We need a model that is flexible enough to naturally encompass the sorts of things we’ve illustrated above, but one that also provides us with meaningful, understandable insights that we can learn from.
“Specifically, we think a Generalized Additive Model (“GAM” for short) ought to work nicely. The math can get complicated, but the bottom line is pretty straightforward – we draw a bunch of curves like we did above for field position and yards to gain, only we do them all at the same time, holding the effect of one constant while we derive the contribution of the other. In our case, instead of drawing just one line for “yards to gain” overall, we can draw one line for each different down. In other words, we find the effect of down and distance together, above and beyond the influence of field position, and also find the effect of field position, above and beyond the influence of down and distance. Then, to find the expected yardage for any particular set of circumstances, we simply start with something pretty close to the league average, then add together these different effects that make running relatively easier or harder – that’s why ‘additive’ is right in the name!”
After feeding the GAM our data, it’s pretty quick to decide that, all other things equal, yards to gain really hasn’t made a huge difference on 2nd downs. Maybe a couple inches here or there. It also decides that it really doesn’t have enough data to make a determination about 4th downs. But yards to gain really makes a big difference on 3rd downs.
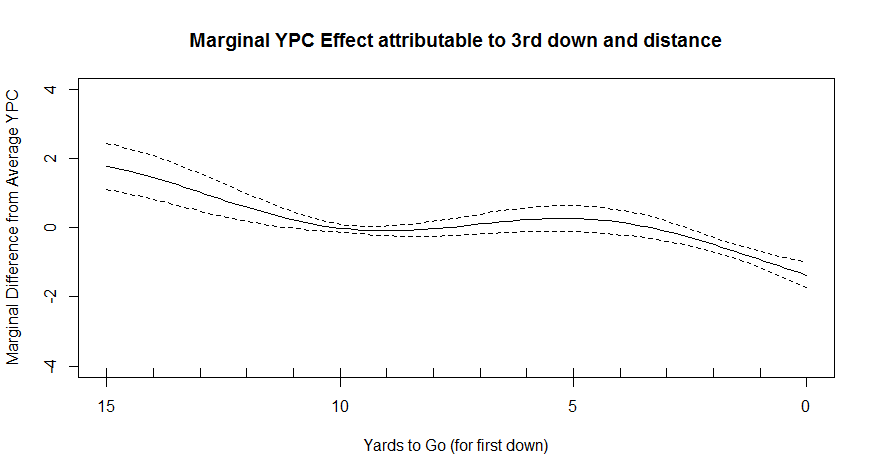
Everything in this chart is showing our expectations for 3rd downs. The x-axis shows the yards to go for a 1st down. The y-axis shows how much we should add or subtract to our expectations for rushing yards given the yards to gain. From a 3rd and 10, we expect a runner to be about average. From a 3rd and 1, we expect a runner to be about 1 YPC below average. From a 3rd and 15, we expect a runner to be about 1.5 YPC above average. Running from a 3rd and 1 reduces expected yardage by about a full yard compared to running from a 3rd and 5. By comparison, running on a 3rd and long, with more than 10 yards to gain, can add a yard or two to your expected yards per carry.
1st downs are an interesting case. You will nearly always be running from a 1st and 10, though sometimes a penalty might push you back to a 1st and 15 or a 1st and 20. But most of the time a player has less than 10 yards to go on a 1st down is if that player is actually running on a 1st and goal (there are some penalties that can cause a team to start on a 1st and 5, but these account for less than 1% of first down rushing attempts, and are about an order of magnitude less frequent than runs from inside the 10). So if you actually map out the expected yardage on first downs, you’re essentially just mapping out the goal line effect. Because this GAM already accounted for the goal line effect (because it derives all the effects together, all at once), we shouldn’t actually expect to see any 1st down effects here, because the model doesn’t want to count the goal line effect twice.
And indeed, that’s exactly what we get. No first down influence -
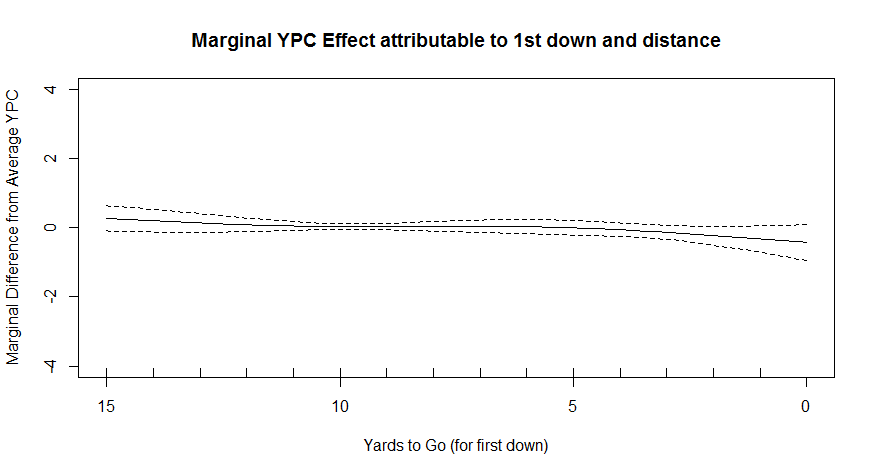
because the goal-line effect has already been accounted for:
This same concept of “additivity” works for other situational factors too. Like, for example, the score.
A Matter of Time
Pop quiz. Who’s more likely to be better running the ball: the winning team, or the losing team? On the one hand, the winning team is the one that we might expect to have the better offense, on average. It’s plausible that when a team has a really great day with the ground game, they’re more likely to be winning. But on the other hand, it’s also plausible that the losing team is going to go more pass-heavy in an attempt to mount a comeback with high-risk high-reward plays, and if defenses react to cover the pass (e.g. keeping two high safeties or playing out of a nickel base package), it could open up room for the run game. If a team is up 21, they’d rather give up the occasional 5-10 yard run than give up the 80-yard touchdown (though I think a lot of coaches are actually way too quick to move into prevent defense, but that’s a topic for another time). So which is it? Do we expect to see the better ground game from the winning team or the losing team?
“Actually, it depends on the time.”
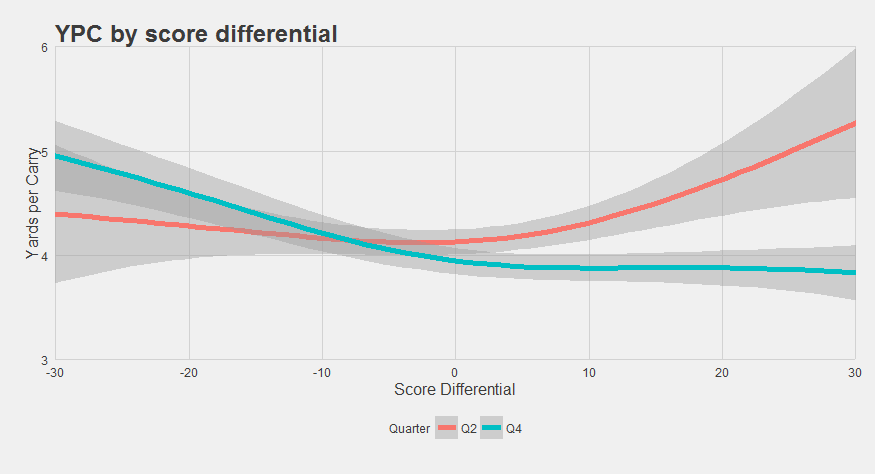
This shows how well teams are running the ball in the 2nd quarter (red), and in the 4th quarter (blue). Winning teams are on the right, losing teams are on the left, and the y-axis is expected yardage on a rushing attempt.
In the first half, the team that runs the ball better is more likely to be the team that’s winning in the first half. On average, you’d expect a team up by two touchdowns early in the game to be going an extra half-yard on all their rushing attempts.
“We’re speculating with the causality of this effect. It could also be that defenses that give up a bunch of touchdowns early in the game get dispirited or tired or shift to protect against the pass. We just personally find it more likely that an explosive ground game makes it easier to win.”
But the second half shows the exact opposite. In the 4th quarter, it’s the losing team that runs the ball better. Being down 2-3 touchdowns in the 4th is worth about an extra half-yard, and being down 4 touchdowns in the 4th is worth about an extra yard per run. At the same time, winning teams tend to run significantly below the average (around 4.2 YPC, remember?) late in the game. Defenses probably know the winning team is going to run in order to burn clock, though it’s also plausible that offenses trot out second-stringers to get some reps when the game isn’t really in doubt any more.
“We can adjust for the skill of different players in our model, though, to account for the skill of different running backs, and we still see mostly the same pattern of score effects in each half.”
So where does this all leave us? Well, all of the ways that the situation influences the run game follows a similar pattern. There are certain cases where running the ball is more valuable to an offense, such as when a short-yardage gain is needed to get a first down or to enter field-goal range, when you don’t want to risk an interception near the goal line, and when you need to burn clock to close out a win. Above, we show that all of these circumstances lead to diminished running effectiveness. It’s a perfect example of game theory in action: in a zero-sum game, the best bet for the competition is to take away your best move.
“More precisely, an ideal strategy in many zero-sum games is to ‘make a guess at the probabilities that you think your opponent will play his/her various pure strategies, and choose a best response against your guess.’ The trick is to be better at guessing than the other guy.”
This gives football a sort of beautiful equilibrium. Everywhere you look, you can see the evidence of the struggle by the defense to take away the most valuable option available to the offense. The strategic decisions by the coaches in different game situations trace a visible path through the statistics. It means that there is a constant pressure to stay unpredictable, to innovate, and to convince the defense beyond a shred of doubt that you could do anything at any time. Make guessing harder for them than it is for you. This is something a lot of stat-heads often fail to appreciate: sometimes, you want to make a suboptimal call on purpose, because it changes what the defense believes you are capable of for the rest of the game, the season, or even your career.
“Meaning that, once in a blue moon, you might just want to consider handing the ball to your running back on a 4th and long.”
CHAPTER SUMMARY
- The situation matters. Expected value on a run depends on the context (possibly through play calls by the offense and defense).
- In general, when running is the more valuable strategy for the offense, the defense tries to take away that option, and running efficiency is reduced.
- Rushing attempts on 1st and 2nd down go further than rushing attempts on 3rd and 4th downs.
- Rushing attempts close to the line of gain tend to be shorter than rushing attempts further from the line of game.
- Down and distance are correlated. More than half of all 3rd down runs by a running back take place within 2 yards of the first down, and more than half of 4th down attempts take place within 1 yard.
- Within the 25, running the ball starts to become increasingly less efficient. Much of this difference is due to the goal-line cutoff (where it’s not possible to gain more yards past the goal line if you score a touchdown), but a half-yard of this decrease is attributable to other game factors (possibly defensive play calls and the compressed field).
- There is also tentative evidence for a slight drop in running efficiency as the offense nears field goal range.
- The complete model of down, distance, and field position indicated two major distince influences: 1) the goal line effect, and 2) a line of gain effect specifically on third downs (where running on a third and short is particularly hard). (Note: this “generalized additive model” essentially works by drawing flexible curves over the specified context features, then adding them together for any given rushing attempts).
- Early in the game, the winning team is more likely to have better rushing attempts, on average. Late in the game, the losing team is more likely to have better rushing attempts. Being up 2 touchdowns in the 1st half or down 2 touchdowns in the 2nd half is worth about an extra half-yard.
- The tendency for defenses to take away the run when running would be most valuable to the offense is exactly what we’d expect according to game theory: the ideal strategy for a defense is to guess the probabilities of different moves by the offense, and choose the best strategy against that guess.
- As a consequence, football teams are incentivized to be unpredictable in their offensive play calls. Sometimes, the best offensive play is the suboptimal one, and that means running the ball sometimes even when passing might have a higher expected yardage.