Waaaay back in chapter 1, within minutes of making the Ground Control project live, I showed you this picture, and told you this:
There’s really a lot you can learn from a density plot like this.
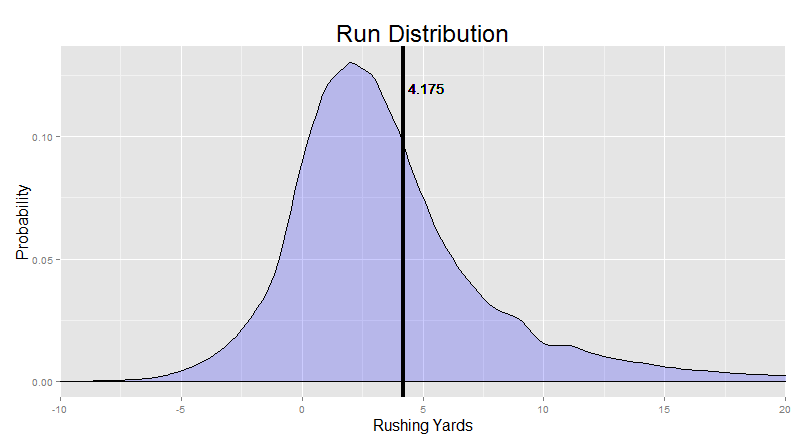
You can really see the “skew” we were discussing earlier (the Bill Gates thing). That long right tail goes all the way out to 100 yards. We just cut it off early for this chart. The black line down the middle, the mean yardage, is clearly pulled in that direction from that small set of very long runs.
You can see how common it actually is to lose yardage on a run. You can see the mode at 2 yards (the most common outcome). You can see the big bulk of runs going just a couple of yards. My favorite part – you can even see the slight “divot” at exactly 10 yards, where people are more likely to get exactly 9 or exactly 11 yards than exactly 10. We’ll come back to that one later.
It’s time. Let’s talk about the divot.
 "The 10-yard divot isn't an error or an outlier. There's too much data (tens of thousands of runs) for it to be noise. Rather, the 10-yard divot is a deviation from our expectations about how football ought to work. We look at this run distribution and our brain sees a very clear trend: the longer the distance, the fewer the runs, with sharp differences in the early yards (e.g. the number of runs that go 3 yards versus 4 yards) and gradually decreasing differences in the open field (e.g. small differences between the number of 15 yard runs and 16 yard runs). We see a smooth line, a graceful curve, running down the right side of the chart. The 10-yard divot is a blemish on the perfection we want to impose."
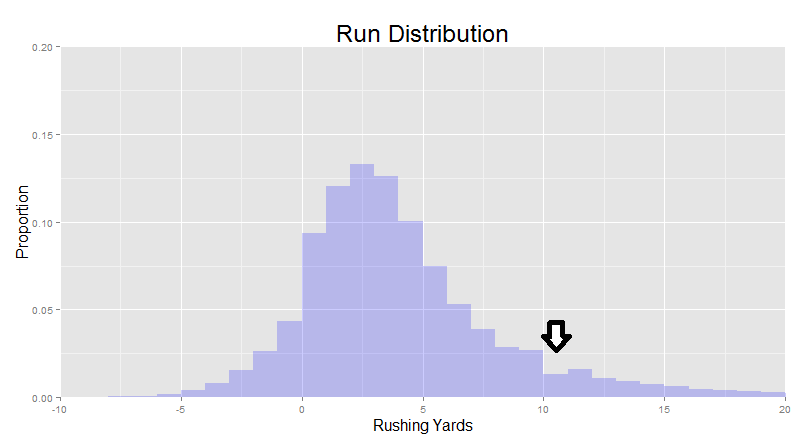
You can see the exact nature of the deviation at 10 yards if we leave things as a histogram instead of smoothing over the yardages:
"The divot doesn't make sense because why would making a 11 yard run be easier than making a 10 yard run? The divot doesn't make sense because why are 10-yard runs specifically so hard?"
This was my first impression, at least. Of course, it turned out to be asking the wrong question.
"The astute among you may have already guessed that the exact yardage isn't what's important here. What's important is the thing that is there. And if you're running on a first and 10 (as players often are), the thing that's ten yards away is the line of gain."
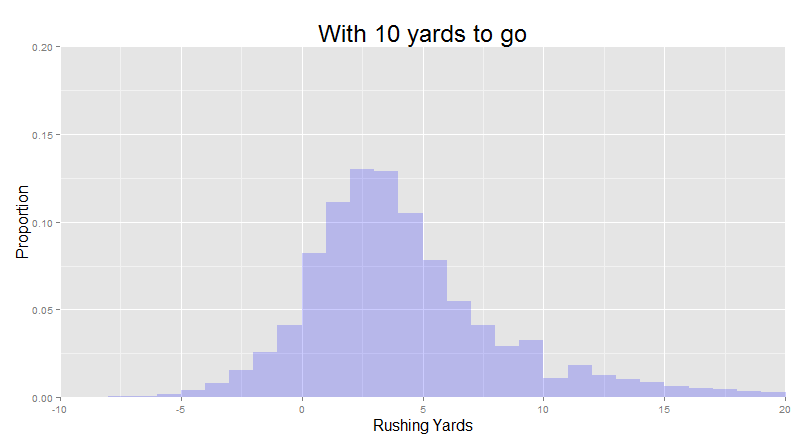
So if we restrict our visualization to only the cases where there are 10 yards to go, we naturally see the 10 yard divot:
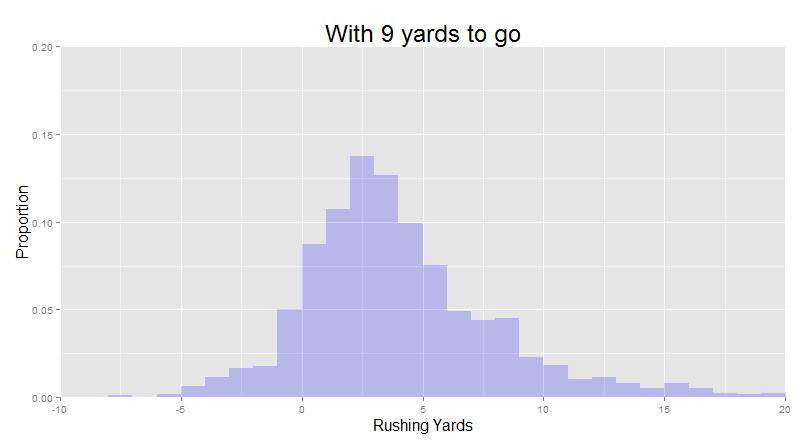
But if we look at cases where there is 9 yards to go for a first down, we instead see a 9-yard divot (with a big dropoff between 8 yard runs and 9 yard runs).
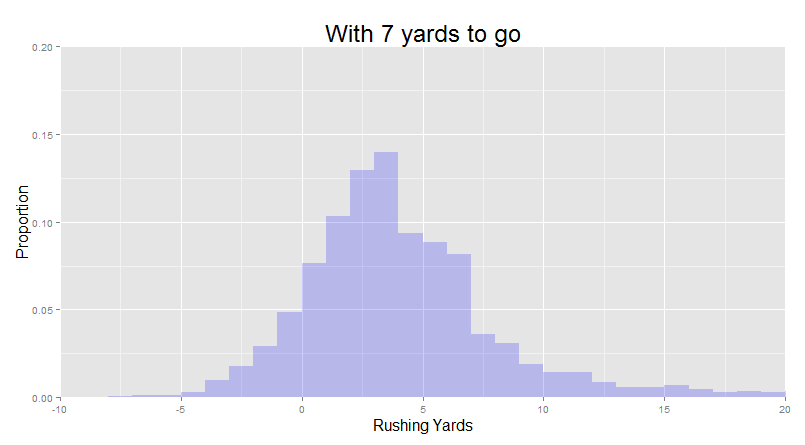
And if we look at cases where there is 7 yards to go, we see a 7-yard divot (with a big dropoff between 6 yard runs and 7 yard runs).
We can even see a 4-yard divot on downs with 4 to go.
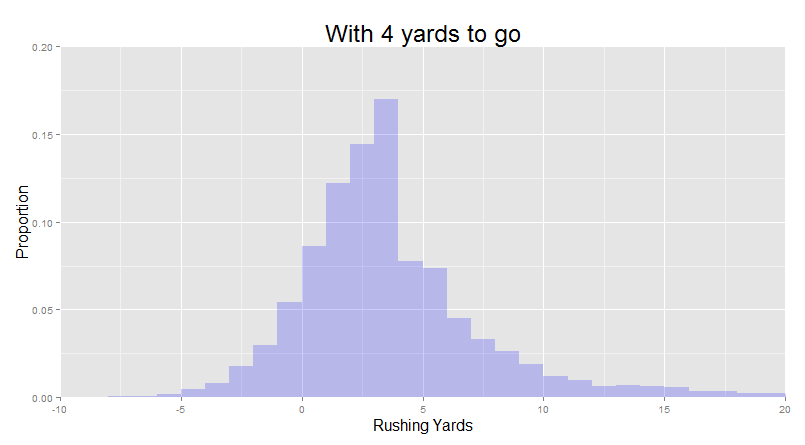
"And all of a sudden, the trend in the data got significantly more interesting. The 10-yard divot isn't really "at" 10 yards at all. It's really a first-down divot. The only reason why we even saw it at 10 yards in the first place is the high frequency with which running backs tend to run on first and 10."
So what could be driving this “wall” that running backs keep hitting right before they get to the first down marker? Well, one possibility is that defenses want to stop the first down above all else. Perhaps rather than playing to stop every inch, they play to stop every first down? Perhaps they would yield a step here and there if it meant setting up a can’t-miss tackle and lowering the chances of giving away a new set of downs on the ground? I find this explanation totally plausible. In essence, the defense plays different near the line of gain, because they know it’s there and want to stop a running from passing it above almost everything else.
But I think there’s also another possibility. An explanation that actually doesn’t depend on either the players or the refs at all.
"In the NFL rulebook, referees are instructed by Section 19, Article 1 of Rule 3 to spot the ball with the forward point at the plane across the field that the forward point of the ball was at when the previous play ended, which is exact and doesn’t care about yard markers. But the statisticians are instructed by the NFL Guide for Statisticians to always round “up” towards the end zone when recording the line of scrimmage (excepting a few particular circumstances, such as when there less than a yard left for first down [where you round down to leave 1 yard to indicate that the first down was not gained] or cases where the ball is spotted on top of a yard line). This can yield some funny outcomes. For instance, if somebody starts a run a few inches ahead of a twenty-yard marker (so “opp 19”) and runs nearly 10 yards (say on top of the “opp 10”), they are only credited with 8 yards – the “official” start of the run was rounded up to begin nearly a yard further downfield, and the “official” end of the run was rounded down to indicate that the first down was not gained."
The record-keepers always round down within a yard of the line of gain, but round up almost everywhere else. Let’s say you carry the ball 9.5 yards, and refs spot it exactly. If you started that run on a second and 9, the scorekeepers round it up to a 10 yard run. But if you started that run on a first and 10, the scorekeepers round down to a 9 yard run, because it doesn’t make sense in their eyes to award a 10-yard run on a first and 10 when the team didn’t actually gain a first down. You’d have some 10-yard runs that went for a first down, and some 10-yard runs that didn’t. Naturally, such a scorekeeping rule results in exactly the pattern that we see: fewer runs registered at the distance needed for a first down (e.g. fewer 10-yard runs on first and 10s) and more runs registered at 1 yard short (e.g. 9 yards plus whatever is now rounded down). I also find this explanation totally plausible.
So which is it? We know that the scorekeeper’s rounding artificially reduces the number of 10-yard runs recorded on a first and 10 (because if the first down marker wasn’t there, the same runs would have been recorded as a 10 yard run), and we know that the rounding artificially increases the number of 9-yard runs recorded on a first and 10, but because it is also plausible that the defense plays differently near the first down markers (which would also lead to fewer 10-yard runs and more 9-yard runs on a first and 10), and we can’t completely distinguish the scorekeeper effect from the defense effect. They both look the same in the yardages - they both can contribute to the 10-yard divot.
"What I love about the 10-yard divot is that there's no way for us to know given the data that we have. If all you have is yardages, you can't tell the difference between the yardage quirks produced by players and defenses and the yardage quirks produced by scorekeepers. The ten-yard divot is clearly visible in the data that we have, and it's clearly real. But the reason for its existence remains a mystery, because our data is in whole yards instead of inches."
Having exact measurements would allow us to resolve the mystery with ease. If the rounding roles of the scorekeepers was creating the divot, then exact measurements wouldn’t show any divot at all, because nothing would need to be rounded! In contrast, if defensive play was mostly responsible for the divot, then even exact measurements would still show it - we would just see the stops in more granular detail.
But at present, it’s a case where we just have to be resolved with not knowing. In science, it’s cases like these that drive innovation more than anything else. We have a question, we have two plausible hypotheses, and we lack the capability to distinguish between them with the technology currently available to us. The next steps all of a sudden resolve into focus: invent the thing that would allow you to find the answer.