The Central Tendency
When a coach calls a running play in the NFL, what do they expect to see? What does a “typical” run look like? A good coach would probably say “it depends”: every call is intended to exploit the anticipated defense (or to set up a future attack on a particular defense) in a particular way in a particular circumstance. Designing runs is hard, calling the right play at the right time is hard, and executing a solid run is hard (but fun: offensive linemen generally would prefer mauling the hell out of the guy across from them then dropping back into pass protection any day of the week).
But let’s abstract over particular situations, defenses, and plays for a moment. Assume that, over the long run, there’s an archetypal balance point for how a rushing attempt meets a run defense. You give the running back the ball. How far does he typically go?
 “There’s about a million ways to answer that question.”
But the ubiquity with which people throw “yards per carry” stats around make me think it’s something that a lot of us are interested in. Our job is to find the most appropriate answer to that intuitive interest. So let’s hear it, Bernie. What do you got for us?
“Well, you mentioned yards per carry (YPC) already. Over the past six regular seasons, the average run by a running back is about 4.175 yards. This is the ‘expected value’ of the run when you call it.”
It’s what most of us probably thought of first when we thought of the “typical” run: a hair over four yards. That’s the ‘mean’ yardage gained on a run. It’s nice and easy to calculate: just take all your rushing plays, add the yardage together, and divide by rushing attempts. This is usually a relatively stable number in modern football, though it does wax and wane a bit year by year, depending on the relative quality of offensive and defensive schemes and players (along with some random chance). Here is the league-wide yards per carry for running backs over each of the past six seasons:
| Year | YPC |
|---|---|
| 2010 | 4.18 |
| 2011 | 4.32 |
| 2012 | 4.24 |
| 2013 | 4.10 |
| 2014 | 4.13 |
| 2015 | 4.09 |
“But YPC has some issues. For starters, it’s heavily influenced by big runs. Being pulled around by large values is a consideration whenever you use the mean as a measure of central tendency. For example, when Bill Gates walks into a room, the “average” person in that room becomes a multi-millionaire, even if not a single person is actually a multi-millionaire (Gates is a billionaire and everybody else in this scenario is a poor schmuck). Because of the occasional fifty yard run, the mean value is a bit on the optimistic side. Get this: the most common outcome of a run is just two yards.”
This is called the “mode”, or the value appearing with the highest frequency in the data. Every single year in modern football, the three most common outcomes of a rushing attempt are one yard, two yards, or three yards (the typical order is 2/3/1). Like I said, running is hard.
“Another problem with that ‘4.18’ number is that very good running backs tend to get many more carries than average or below-average running backs, so the number is skewed in favor of a very high talent level. If you just picked a running back at random from the NFL and gave him the ball, or hell, even got a league-average running back on purpose, your expected value would almost certainly be lower than 4.2.”
That’s quite right, and it leads to the somewhat bizarre situation where most running backs are “below average” compared to the league-average YPC. And that’s no wonder, when the “average” is largely made up of high-volume guys like Adrian Peterson, who had more rushing attempts in 2015 than anyone. It’s very hard to “beat the average” when “average” is pulled in the direction of Adrian Peterson.
One way to get around this is to find the average YPC for each running back individually, then averaging those averages together. This way, each player is weighted equally in the resulting mean. If we calculate this “YPC over players”, we get a much lower 3.54 yards per carry for the past six years. If you picked an NFL running back at random (as opposed to picking a run at random), and gave him the ball in a league-average situation, that would be your expected yardage (not 4.2).
“But there are other measures of central tendency we could use instead - ones that aren’t particularly influenced by that smattering of long runs we mentioned. For example, the median run, which is about 3 yards. We don’t know how far exactly the median run is, because yardage is only recorded in terms of discrete yards, but it’s probably somewhere between 3 and 3.5.”
If we line up all the runs in a given season in order of shortest to longest, the median is the rushing attempt right in the middle. It’s also known as the 50th percentile – i.e. half of all runs go about 3 yards.
I say “about” because only whole yards are recorded in the stat books, and play spotting is a bit dicey to begin with. In the official statistics for rushing attempts, the median is exactly three yards – just keep in mind that the “real” median is probably slightly more. The mean does not have this problem because we are averaging together a lot of whole numbers, which has no problem producing decimals.
“The implications of the way NFL stats are officially recorded is actually pretty interesting. In the NFL rulebook, referees are instructed by Section 19, Article 1 of Rule 3 to spot the ball with the forward point at the plane across the field that the forward point of the ball was at when the previous play ended, which is exact and doesn’t care about yard markers. But the statisticians are instructed by the NFL Guide for Statisticians to always round “up” towards the end zone when recording the line of scrimmage (excepting a few particular circumstances, such as when there less than a yard left for first down [where you round down to leave 1 yard to indicate that the first down was not gained] or cases where the ball is spotted on top of a yard line). This can yield some funny outcomes – for instance, if a team throws an incomplete pass on a 4th down, and the line of scrimmage is between the opponent’s 15th and 16th yard markers, the official field position is “opp 15” on the 4th down, but then flips around to “own 16” after the other team gains possession, despite the fact that no yardage was actually gained or loss on the play. Further, yardage gained on a typical play is calculated as the difference between the starting official field position and the ending official field position. That can lead to situations where, for instance, somebody starts a run a few inches ahead of a twenty-yard marker (so “opp 19”) and runs nearly 10 yards (say on top of the “opp 10”), but is only credited with 8 yards – the “official” start of the run was rounded up to begin nearly a yard further downfield, and the “official” end of the run was rounded down to indicate that the first down was not gained.”
We discuss further implications of that in a quick hit here. But the main takeaway for now is that official NFL yardages are only ever recorded in whole yards. That means we don’t know how far exactly somebody runs on any given play – we only know how the official line of scrimmage changes before and after a running play.
Anyways, the idea of quantiles or “percentiles” (like the median at the 50th percentile) can, I think, still be a useful one for us here, even if it is rounded off to the nearest whole number. There are two general rules I want you to remember.
FP’s Rules of Run Quantiles
Summary numbers of the run distribution.
- The 1-3-5 rule. Over a quarter of rushing attempts are over by 1 yard. About half of rushing attempts are over by 3 yards. About ¾ of rushing attempts are over by 5 yards. These are the first, second (median), and third quartiles. (note: along with the minimum and maximum (-17 and 97 yards in this data set, respectively), this comprises the five-number summary popularized by my man Tukey).
- The 10 at 10 rule. Any run that goes at least 10 yards is among the longest 10% of rushing attempts. This is the 90th percentile. By comparison, all runs that lose a yard or more among the 10% worst rushing attempts.
So what do you think, Ernie? Any critical insights here before we move on?
“I think this is all tedious bullshit and I’d rather just show the people what the run distribution looks like.”
… yeah OK that’s fair.
The Run Distribution
When you give a guy a football, this is what we think you should see in his future:
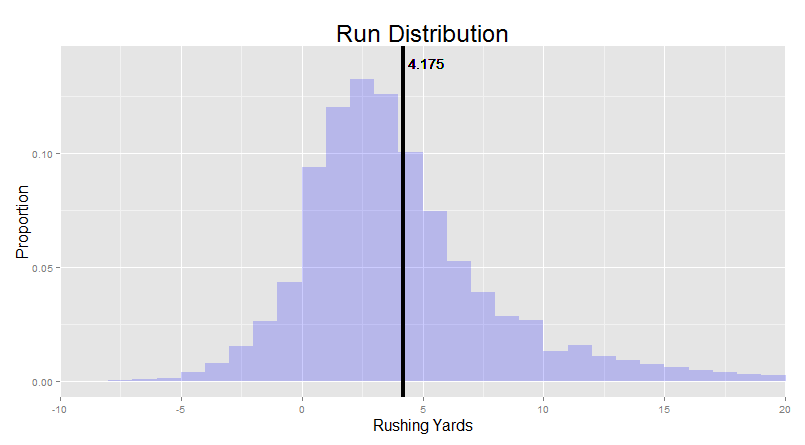
See, before the play has actually unfolded, a “point estimate” of what to expect (like a mean, median, or mode), is just not going to cut it here. Running the ball is a game of probabilities. He might get creamed behind the line of scrimmage by a DT that caught their blocker flat-footed. The TE might open up an unexpected gap for an easy five. A linebacker might hesitate on diagnosing a run to the outside because of all the play-fakes you’ve been throwing at him. And every once in a while, your running back might hit the crease at just the right time, break a tackle, and sprint away into an open secondary. There are so many moving parts, running the ball for a particular amount of yardage is always a bit of a gamble.
So rather than thinking “here is the average, and some run is either above or below that average”, we want you to flip the script. Instead, consider that there is a universe of possibilities that could occur when you hand that ball to your running back. By the end of the play, we’ve witnessed one of those universes. In short, we’ve taken a sample from a probability distribution.
What I’ve shown you above is called a “histogram”. It shows the proportion of runs that have gone for each number of yards. As I mentioned above, these discrete “steps” are just a reflection of the stat-keeping, not the actual run. So let’s smooth over them:
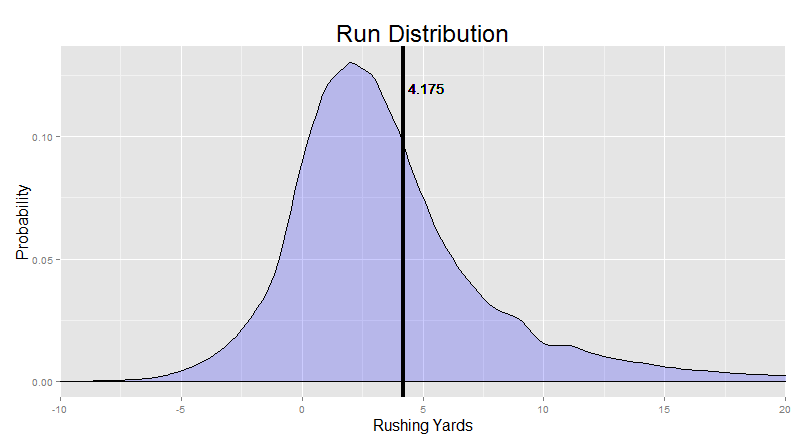
“Now THAT is what a typical run looks like!”
There’s really a lot you can learn from a density plot like this.
You can really see the “skew” we were discussing earlier (the Bill Gates thing). That long right tail goes all the way out to 100 yards. We just cut it off early for this chart. The black line done the middle, the mean yardage, is clearly pulled in that direction from that small set of very long runs.
You can see how common it actually is to lose yardage on a run. You can see the mode at 2 yards (the most common outcome). You can see the big bulk of runs going just a couple of yards. My favorite part – you can even see the slight “divot” at exactly 10 yards, where people are more likely to get exactly 9 or exactly 11 yards than exactly 10. More on that here.
But seeing those quantiles – the medians, the 90th percentile etc – is a bit tough here. We can make things easier for you by rearranging the data a bit. Rather that show the density at each point (i.e. the proportion of runs that go exactly a particular amount of yards), we can instead add up the cumulative density at each point (i.e. the proportion of runs that go at least a particular amount of yards).
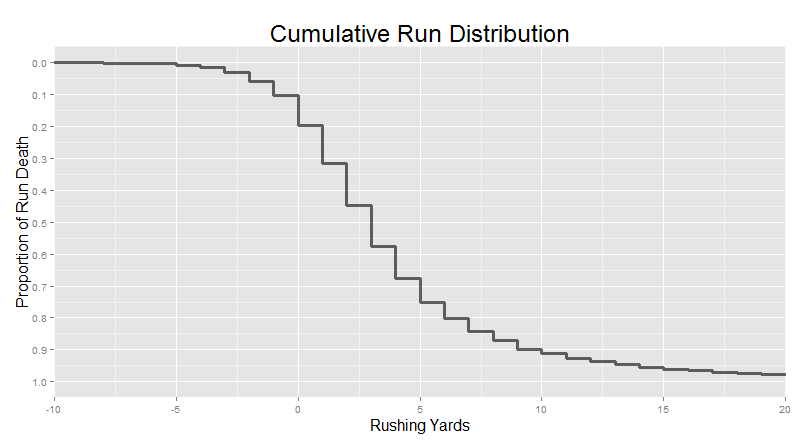
These can be tough to read if you’re not used to them. Just find a rushing yardage you’re interested in along the x-axis. Say 0 yards – the line of scrimmage. Move straight up from there until you hit the line – in this case, at about 0.2 on the y-axis. That means that about 20% of runs are already over by the time they reach the line of scrimmage. If you keep moving up, you’ll now be moving along a short vertical segment of the actual cumulative distribution itself. The length of this segment shows the proportion of runs that traveled exactly 0 yards. It corresponds with the relative size of the bars in the histogram above. And finally, keep traveling up and you’ll reach the end of this vertical segment, at about 0.1 along the y-axis. That means that about 10% of runs have ended before you even get to the line of scrimmage. Put it all together, and that one check told you that 10% of runs make negative yardage, and that an additional 10% of runs are stopped at the line, for a total of 20% of runs finished before they even gain positive yardage.
“These cumulative density plots are so information-dense. I’m really quite partial to them.”
Stunner.
Just in case you the reader aren’t, here’s a list of the proportion of runs (out of 1) that have ended by the time they reach particular yardages:
| Yards | proportion dead |
|---|---|
| -3 | 0.0314 |
| -2 | 0.0579 |
| -1 | 0.1015 |
| 0 | 0.1953 |
| 1 | 0.3159 |
| 2 | 0.4486 |
| 3 | 0.5749 |
| 4 | 0.6755 |
| 5 | 0.7501 |
| 6 | 0.803 |
| 7 | 0.842 |
| 8 | 0.8704 |
| 9 | 0.8975 |
| 10 | 0.9106 |
| 11 | 0.9264 |
| 12 | 0.9376 |
| 13 | 0.947 |
| 14 | 0.9545 |
| 15 | 0.9607 |
That covers all runs but the lowest and highest 5%.
The Good News
Now, I’ve given a lot of bad news here so far. One in five runs don’t make it past the line of scrimmage. The most likely outcome is just 2 yards. Half of all runs end by 3 yards. And your odds of making it even 10 yards is 10:1 against.
But there’s some great news hidden inside that long right tail. Let’s say your running back gets the ball, breaks a tackle, and makes it to five yards. How much further, on average, might you expect him to go? Finding this expected value is actually pretty easy. We just look at all the runs that traveled at least five (or whatever) yards, and calculate how far they ended up going before being stopped. The “Yards Left”, if you will.
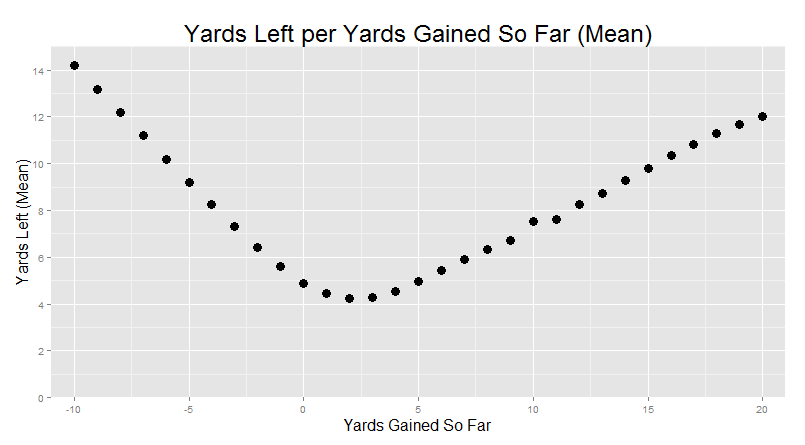
If we look at five yards, you’ll find something pretty heartening: running backs that go at least five yards end up, on average, going for at least another five before going down. And that rate just keeps getting better the further the running back gets into the open field.
“Yeah, but take a look at where you actually start a run, a few yards behind the line of scrimmage. The opposite is true. Every step you take is, on average, a step closer to being tackled.”
Yeah, ok, that’s also true. Take a look at -5 yards. You’ll see that here behind the line of scrimmage, your expected yards remaining is about 9.1 yards. Which, surprise surprise, means that you’ll end up somewhere around… 4.1 yards, are the mean yardage on a rushing attempt. But if you break through the defensive line, things are looking good.
“Basically, you’re seeing in this graph the three major stages of a run: the yards that are blocked, the yards that are contested, and the open field.”
It’s the job of the offensive line try to help more runs go for more yards. In essence, pushing the cumulative density curve further to the right. In this “yards left” graph above, there’s almost a straight line on the left all the way up to about -2 or so yards, meaning that each step is bringing you closer to the actual “danger zone” where you are at risk of being tackled, but the blocking by the line ahead of you generally allows you to travel some “free” yards in the backfield from where you got the ball.
After that point, the defensive line kicks in. It’s their job to stop as many runs for as short of a gain as possible, pushing the cumulative density curve to the left.
“That’s cute that you think that.”
Ok, usually their job. Anyways, as we saw from the previous figures, most runs are stopped in this region, between 0-5 yards, depending the relative maneuvering of the offensive line and the defensive line. A solid running back is one that finds the blocked yards and falls forward every time without coughing up the ball.
But working through that battlezone has a payoff. Each step past the D-Line improves your chances of longer and longer runs. We still have the problem of the skewed distribution and the long right tail when we look at averages, but the same pattern shows up if you look at median yards left.
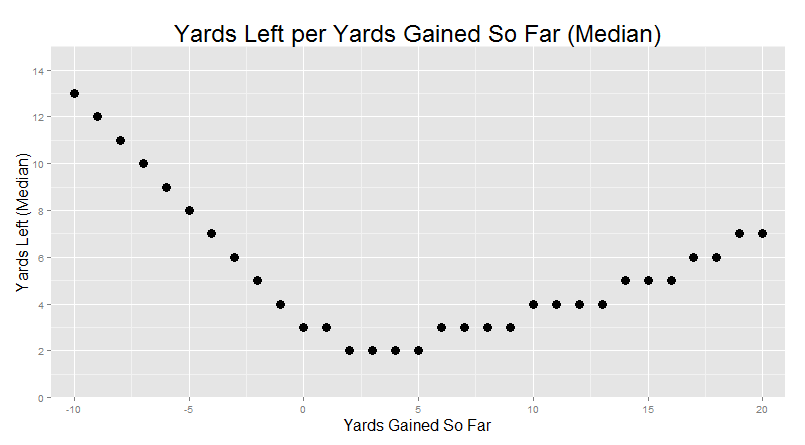
So yeah, running is hard, and most runs don’t get very far. But I find it very hopeful that there is always more yards to look forward to, regardless of where you’re at in a run. Even at the very bottom of that valley, you can fall forward for an extra yard or two. But after that is the sweet taste of open-field running. Running backs should be the ultimate optimists.
CHAPTER SUMMARY
- The average run goes for about 4.2 yards. The average NFL running back has an average YPC of about 3.5.
- The three most common outcomes of a run every year for the past six years have been gains of 1, 2, or 3 yards (usually in the order of 2/3/1).
- The 1-3-5 rule: Over a quarter of rushing attempts are over by 1 yard, about half of rushing attempts are over by 3 yards, and about ¾ of rushing attempts are over by 5 yards.
- The 10 at 10 rule: any run that goes at least 10 yards is among the longest 10% of rushing attempts.
- On the field, the ball is spotted “exactly”, but on the stat sheets, field position (and thus yardage) is rounded “up” towards the end zone to the nearest whole yard (except in some particular circumstances, such as when there is less than a yard to go for a first down, in which case the yardage is rounded down in order to leave 1 yard remaining for the first down instead of 0).
- A rushing attempt can be thought of as taking a sample from a distribution of possible outcomes. Examining the distribution across runs for certain players and circumstances can tell us a lot about the nature of the possible outcomes for that players or circumstances. The distribution of all runs is significantly right-skewed (i.e. has a long right tail indicating that there are just a few runs that go for a very long yardage – the “bill gates” of runs).
- A cumulative density plot shows the proportion of runs that make it to particular yardages.
- There are three phases to a run: the yards that are blocked, the yards that are contested (where most runs are stopped), and the open field. The yards that are blocked are mostly “free” for the running back, who generally uses that time to rapidly approach the contested zone. In contrast, open field running has a special type of momentum: each step past the contested zone increases the expected yards remaining on the run. Running gets easier the further the running back goes.