Run command:
library("shiny");
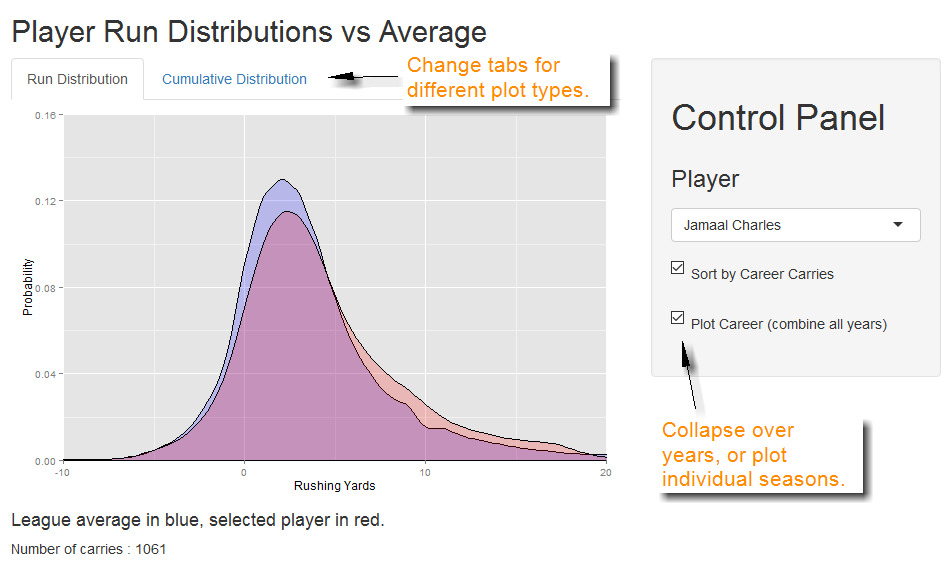
runGitHub("Forever-Peace/GroundControl", subdir = "Chapters/shinyapps/rb_dist/")The purpose of this app is pretty simple: plot the run distribution for any running back since 2010. You can sort alphabetically or by volume, collapse across years or look at individual years, and the app automatically produces two plots: the regular run distribution and the cumulative run distribution (see chapter 1). Number of carries is listed at the bottom. The player you select is always in red, the league average is always in blue.
To get the app, make sure you have R and Rstudio (described here), then copy-paste the run command into the “console” window of RStudio. That’s it!
Note: “Plot Career” only includes carries since 2010, when my data starts.